Modal analysis is one of the most common structural analyses. However, a lot of mechanical engineers are unsure of its fundamental concept, the technique used to perform it and its potential applications. In this article we will attempt to present the concept of modal analysis in a concise and useful way. Wherever required we will provide references for the reader to further their understanding of this topic
What is modal analysis?
“Modal analysis is one of the methods used to evaluate the dynamic characteristics of mechanical components. Moreover, this technique can explain a structure in terms of its natural characteristics. The natural characteristics are natural frequency, damping, and mode shapes.” [1]
Why do we perform modal analysis?
Modal analysis is the most fundamental type of structural dynamics analyses. The information extracted from modal analysis often acts as inputs to other types of analyses such as:
- Response Spectrum Analysis
- Random Vibrations Analysis
- Harmonic Analysis
Proper implementation of modal analysis enables engineers to design robust structures by minimizing the likelihood of undesirable mechanical vibrations.
What is natural frequency?
Frequency is the number of times an event happens in a given time. In wave theory, the frequency of a wave is the number of waves passing through a point in a given time.
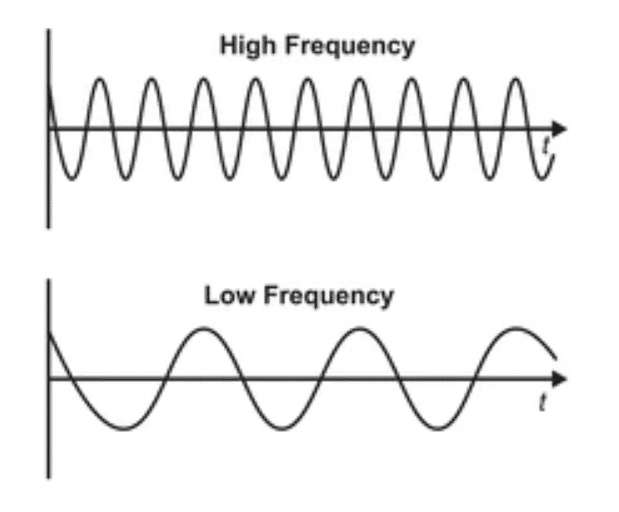
“If a system, after an initial disturbance, is left to vibrate on its own, the frequency with which it oscillates without external forces is known as its natural frequency. As will be seen later, a vibratory system having n degrees of freedom will have, in general, n distinct natural frequencies of vibration.” [2]
The natural frequency is a characteristic of the system and depends only on the stiffness and mass.
What is damping?
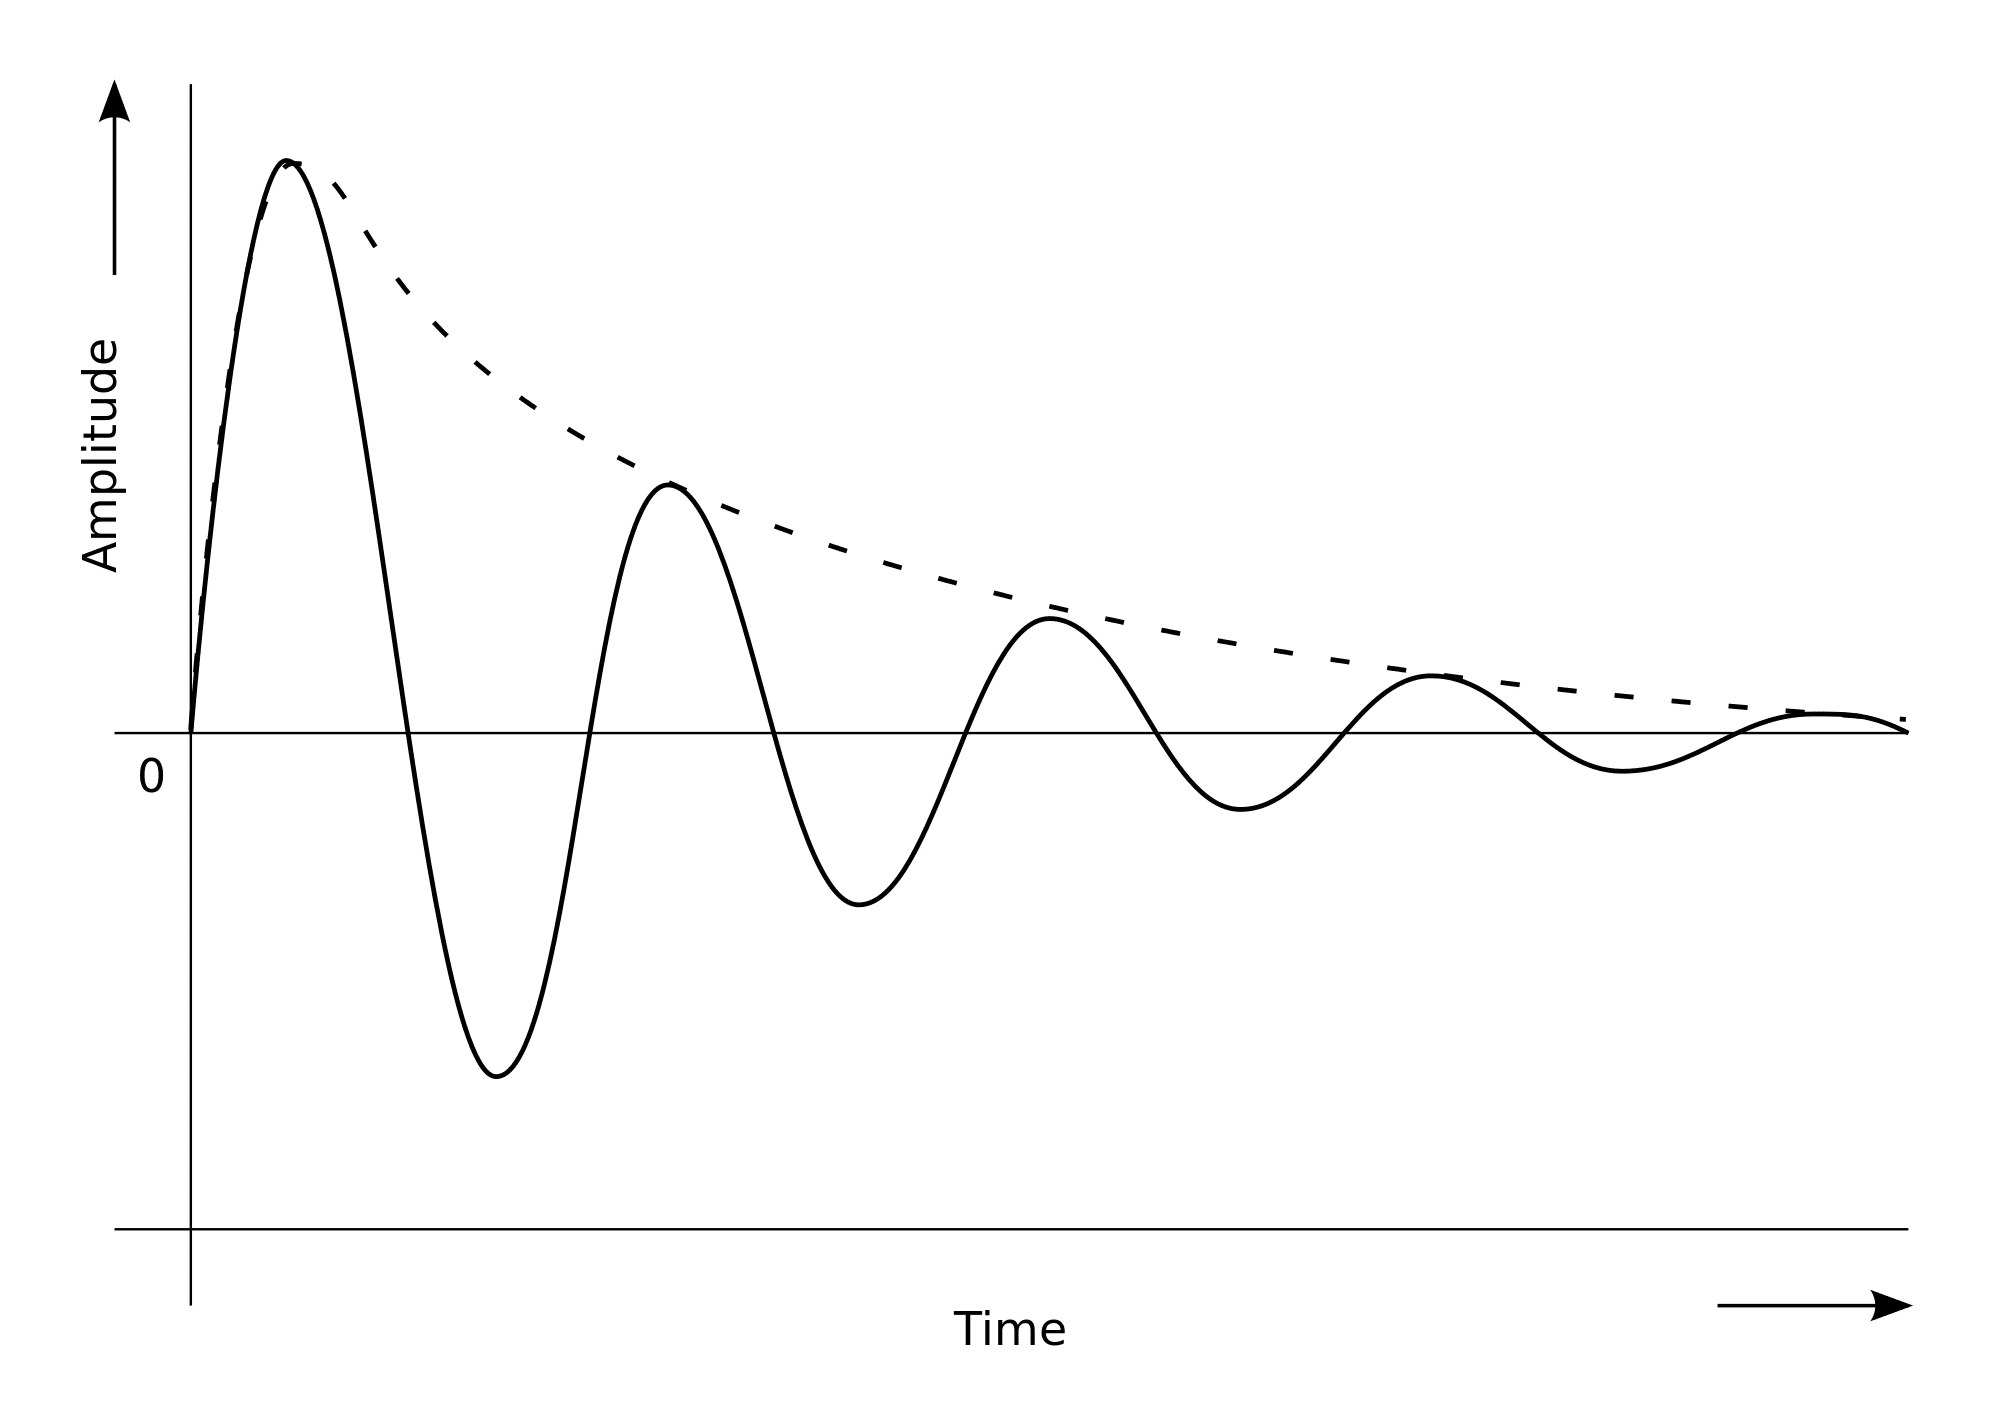
Damping is the process by which the vibrations of a system are restrained. By restraining, we imply that the amplitude of the wave is reduced. In real life, damping happens due to friction between components, air resistance or some other means.
What are mode shapes?
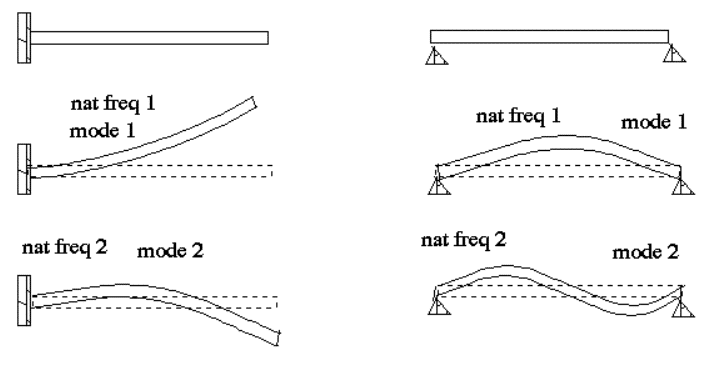
When a component or system vibrates at its natural frequencies it vibrates in certain “patterns”. The patterns (or shapes of the structure) are determined by the directions in which the various parts of the component or system deflect. These patterns are call mode shapes, modal shapes or simply modes. The number and shapes of the modes depend on various factors including the relative stiffness of the components and the way they are constrained in the system.
The math behind modal analysis
The governing equation of motion
The governing equation behind modal analysis is a second order ordinary differential equation [4]:

For modal analysis:
- The external load is set to zero because natural frequency and mode shapes are independent of input load.
- The treatment of damping is fairly complicated and will be ignored for now. Also, ignoring damping gives the worst case scenario.
- This gives us a free and undamped system represented by:

The above equation is an expression of equilibrium in the time domain. With modal analysis however, we are interested in the behavior of systems in the frequency domain. In order to do this we assume that every point in the system is undergoing simple harmonic motion.
What is Simple Harmonic Motion?
Before defining simple harmonic motion, we shall define two other categories of motion:
Periodic Motion: A motion which repeats after a fixed time period called a period. Some examples are the revolution of earth around the sun, the swinging of a pendulum, and the spinning of a fan.
Oscillatory Motion: This is a periodic motion which has a well-defined equilibrium position. All oscillatory motions are periodic. In the examples given above, only the swinging of the pendulum is oscillatory.
Simple Harmonic Motion: This is an oscillatory motion with a restoring force whose magnitude is directly proportional to the displacement from the equilibrium position. The restoring force is called as such because it restores the oscillating body to its equilibrium position. A pendulum may or may not exhibit SHM. If it does it is called a simple pendulum.
One of the most common example of SHM is an ideal mass-spring system.

Simple harmonic motion can be described by the following equation.

Note the similarity of this equation with the y-coordinate of an object undergoing circular motion:
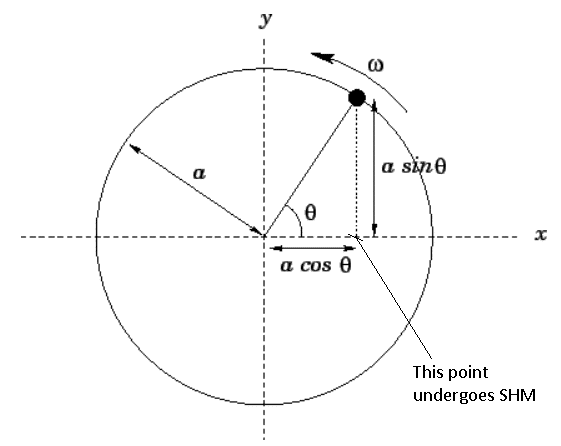
This is not surprising. The 1-D projection of uniform circular motion represents simple harmonic motion.
The Eigenvalue Problem
We can use the expressions for velocity and accelerations for SHM in the governing equation of motion as follows:
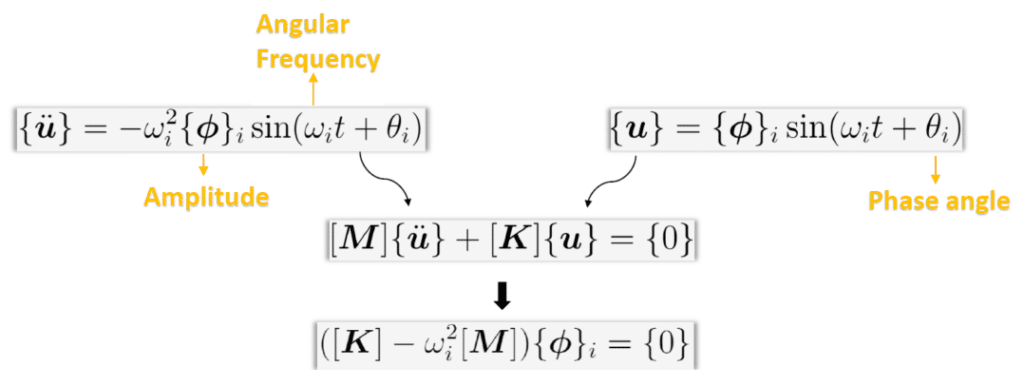
The sinusoidal terms and phase angle are dropped in the derivation. The two unknowns in Equation 3 are omega and phi. To solve for the unknowns Equation 3 can be converted to an eigenvalue problem with omega being the eigenvalue and phi being the eigenvector.
𝜔𝑖 is called the angular frequency of a structure. It can be related to natural frequency by:

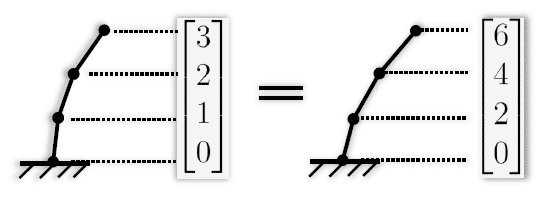
The eigenvector 𝜙𝑖 gives the mode shape corresponding to 𝑓𝑖. Mode shape refers to the deformation patterns at certain natural frequencies.
How do we select relevant natural frequencies?
Theoretically, a structure has as many modes as degrees of freedom. Some structural models might have millions of degrees of freedom. How do we know how many modes to calculate and which ones are significant from a design stand point? This is where the concepts of mode participation factor and effective mass come in.
What is mode participation factor?
The participation factor gives an indication of how much mass is moving for each mode. It is calculated as follows:

where {D} is the unit displacement spectrum and depends on the direction of excitation in each of the global directions and rotations about these axes.
The effective mass is the square of the participation factor.

A high participation factor and effective mass represent modes which will be excited with high forces and the structure will possess high kinetic energy.
Selecting the relevant modes
A modal analysis result will provide a table similar to the one shown below:

The table shows the results of a modal analysis which extracted 12 modes. Modes 1,5,and 11 report the highest effective masses.
The sum of the ratios of eff. mass to total mass would ideally sum to 1.0 but this is rarely the case because 1) Not all modes are extracted and 2) Not all of the mass in the system participates. The mass that is restrained remains stationary.
What about the displacements?
The displacements reported by a modal analysis are not absolute. They are relative deformations of the structure. The mode shapes can be plotted at any scale, as shown in the image below:
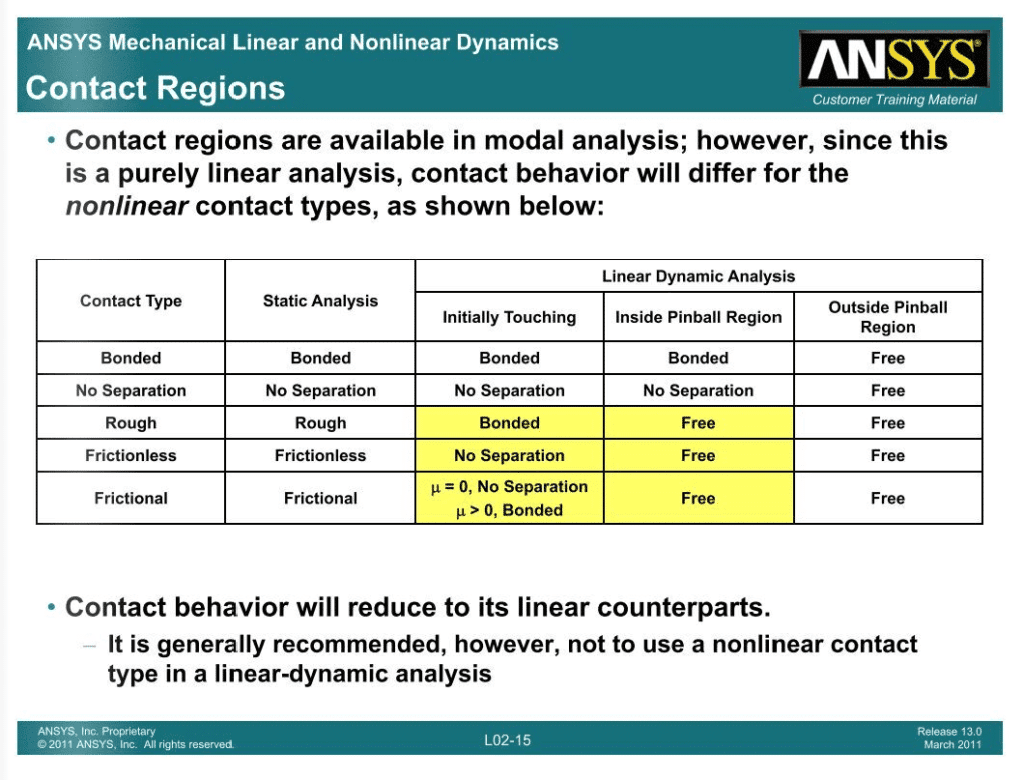
Contacts in modal Analysis
The following has been taken from ANSYS training material:
Summary
- Modal analysis is the most fundamental of dynamic analyses.
- It is a linear dynamic analysis performed in the frequency domain.
- The governing equation is based on an undamped equation of motion with vibrations modeled as simple harmonic motion.
- There are no input loads .
- The analysis predicts natural frequencies and deformation patterns called modal shapes associated with them.
- A structure has as many modes as degrees of freedom but only the first few are relevant.
- Relevant modes can be identified by the effective masses associated with the modes.
- The higher the effective mass the more kinetic energy associated with that mode.
- Engineers can use modal analysis to prevent undesired mechanical vibrations, and resonance in structures.
- Modal analysis often acts as pre-requisites to other dynamic analyses.
References
[1] Tribology of Polymer Composites, Elsevier Series on Tribology and Surface Engineering 2021, Pages 301-319, I. Siva et al.
[2] Fundamentals of Vibration, Anil Rao
[3] https://www.eng.buffalo.edu/~abani/fem/dyn/dynold.html
[4] https://courses.ansys.com/index.php/courses/modal-analysis/
