Introduction
Predicting the structural response of buildings to loads induced by earthquakes is a very complicated problem. There are several layers of complexities built into modeling earthquake loads. Some of the factors that affect how a structure would react to seismic loads are:
- The intensity of the earthquake
- The duration of the earthquake
- The soil characteristics
- The structure of the building
- The location of the building base from the point of origination of the earthquake (fault)
There are several methods which engineers can utilize in order to design safe and cost-efficient structure. In this article we will provide a brief introduction of these methods.
How to Perform a Seismic Analysis ?
The main task of a seismic analysis is to simulate the ground motion due to an the earthquake. It may be described in terms of displacement, velocity or acceleration. There are four common methods to model the response of the excitation:
- Equivalent Static Loads
- Response Spectrum Analysis (RSA)
- Mode Based Time History
- Direct Integration Time History
Equivalent Static Load Method
This is the simplest way of approximating the effects of earthquakes on structures. The main objective is to apply the maximum predicted horizontal load distribution as a static force. The basis for this method is that the response of simple structures (such as a cantilevered beam) is dominated by the first mode (corresponding to low frequency and high mass participation factor – read more on modal analysis). For this reason, this method is not suitable for irregular or highly complex structures. For this method to be valid the structure must be low rise and be fairly symmetric to avoid torsional movement due to the ground motion.
The equivalent static load may be obtained from an appropriate response spectrum.
Response Spectra
Response Spectrum Analysis is a powerful tool in earthquake engineering. The usage and benefit of RSA can be difficult to comprehend, especially if you are just learning the technique. To make it easier to understand we will explain it in a point wise manners:
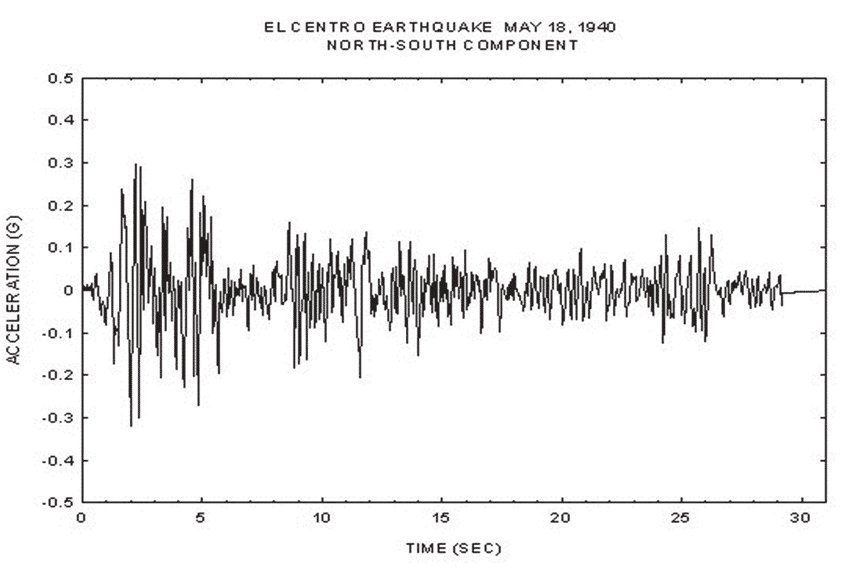
- Seismic Load is often described by Ground Acceleration Time History plots. These are plots of the acceleration of the ground as a function of time for the duration of the earthquake. Figure 2 shows one such plot.
- Under seismic loads, many structures behave like simple harmonic oscillators (SHO). Approximating a vibrating structure as a SHO opens up a lot of opportunities for accurate and useful numerical modeling. RSA is one of the techniques that utilizes this simplification.
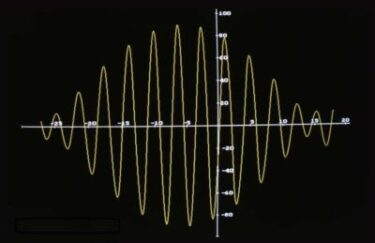
- Consider a simple harmonic oscillator with a frequency (ω). We know that ω is only a function of the stiffness (k) and mass (m). This oscillator can be forced into vibration by a ground acceleration time history. The oscillator will displace with varying accelerations as a function of time. This means that the response time history of the oscillator can be obtained. The response may be displacement, velocity, or acceleration. This process is summarized in the image below:

The peak response in for the oscillator of 30 Hz is an acceleration of 102 m/s2 . This acceleration at this frequency gives us a single data point on a response spectrum plot.
- We can apply the same excitation (ground acceleration) to SHOs of different frequencies, obtain the maximum response and generate a plot of frequencies vs the maximum response value. This plot is a Response Spectrum.
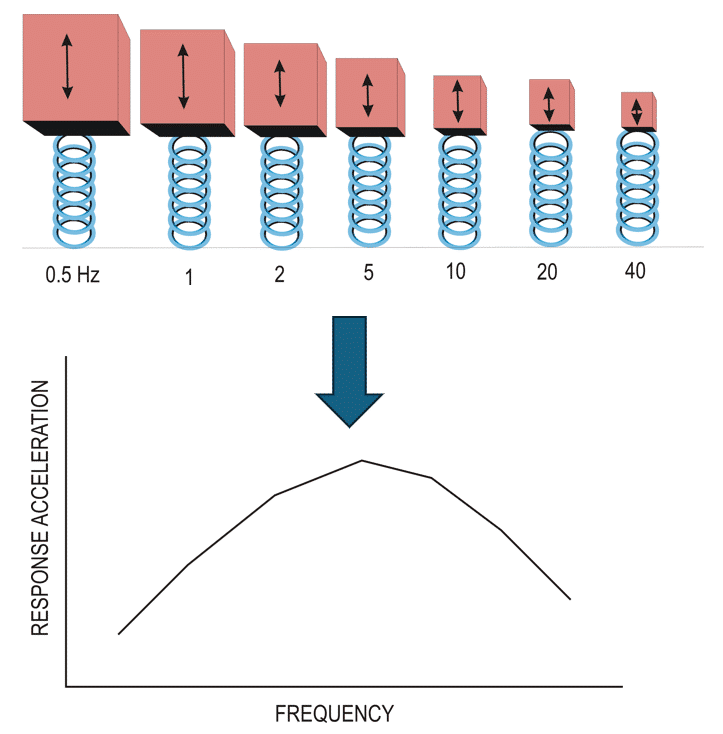
- Often times a single smoothed spectrum is derived from several events (several earthquake records) or several response spectra. This accounts for the random nature of earthquakes. Smoothed spectra also eliminate the undue influence of localized peaks in the response.
- Once the response spectrum plot is available the peak response can be read off the plot. A modal analysis could be utilized to determine the relevant (most dominant) natural frequencies and the response at these frequencies will play the role of the equivalent static load.
- Generation of response spectra does not account for any non-linearities – Mass and stiffness of the oscillators are assumed constant for the duration of the event. Additionally, Material and contact non-linearities are not considered.
Response Spectrum Analysis (RSA)
- The equivalent static load method can be overly conservative. The response spectrum analysis is an alternative that calculates a more accurate response.
- Finite Element method can be used to calculate the maximum response of each mode independently and then combine the effect of these modes using a modal combination mathematical procedure. The solver can utilize a specified set of established mathematical rules to determine the combined effect of the modes.
- Essentially, seismic response of a complex multi-DOF structure is obtained by combining the responses of a number of single-DOF systems with each system representing one of the natural modes. This is why modal analysis (to determine the natural modes) is a pre-requisite for RSA.
- In addition to a modal analysis results, response spectrum data is required as an input for the RSA.
- It must be realized that RSA is a way to provide the analyst with a quick but useful estimate of the peak response of the system. The benefit of RSA lies in its efficiency as opposed to the higher accuracy of more computationally expensive time history analyses.
Mode-Based Time History Analysis
- Mode-Based time history analysis is a linear transient (linear dynamic) analysis which utilizes a modal superposition procedure to calculate the system response for a given time history.
- The advantage of this method over a RSA is that the phase and sign of the individual modal responses is captured.
- The drawback is that a time history input is required (Time history is also required to generate a response spectrum plot but often times the response spectrum plots are readily available but time histories might be harder to obtain).
- One of the applications of this method is in the determination of input motions for assessments of building-mounted equipment.
- A modal analysis of a building together with a selection of ground motion time histories can be used to obtain the floor motion time history.
- The resulting floor time history may be used directly, or converted to a “Floor Response Spectrum” for separate analyses.
Direct Integration Time History Analysis
- This is the most sophisticated and computationally expensive method for seismic analysis.
- It is a non-linear transient (Non-linear dynamic) analysis.
- The equations of motion are solved step-by-step to generate the response of the structure to the time history.
- This method accounts for non-linearities (as opposed to Mode-based time history which is linear)
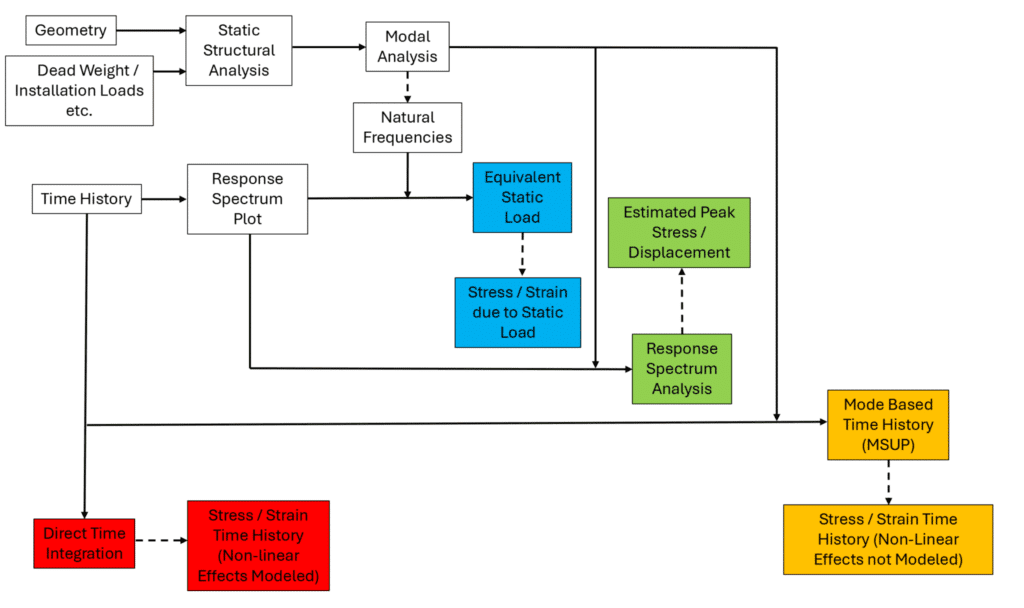
The flowchart below summarizes the content of this article.
References
[1] Bourahla, Equivalent Static Analysis of Structures Subjected to Seismic Actions, Encyclopedia of Earthquake Engineering
[2] Ghimire, Krishna & Chaulagain, Hemchandra. (2021). Common irregularities and its effects on reinforced concrete building response. Structural Mechanics of Engineering Constructions and Buildings. 17. 10.22363/1815-5235-2021-17-1-63-73.
[3] Performing Response Spectrum Analysis Using Ansys Mechanical — Lesson 1