Introduction
Ansys Workbench allows you to animate a result. This is especially useful when you have multiple time steps defined and would like to view how a geometry responds as a result of the application of loads. Often times, I like to plot the total deformation of the model and then animate the result with a magnified displacement scale. This can be a tool to understand the behavior of the system as well as potentially catch any modeling issues which would not be obvious otherwise.
In this brief article we will highlight one of the animation features at your disposal – looping the results over a range of selected time steps.
Test Model
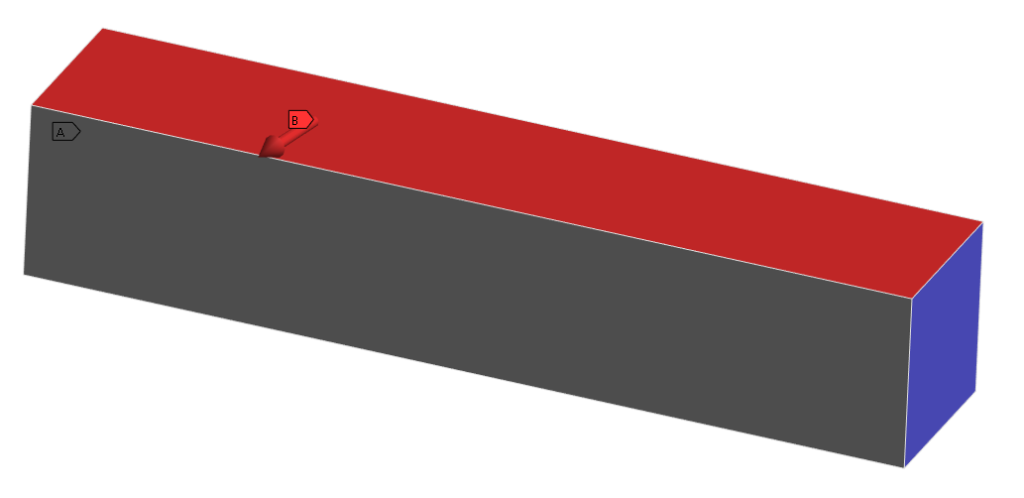
Consider the rectangular beam shown below. It is fixed at both ends (in purple) and a force is applied to the top surface.

The coordinates of the force vary over 10 steps as shown in Figure 2 below:

After running the model we can post process the total deformation. This result can then be animated using the GUI shown in Figure 3.

You can hover over each of the icons within Ansys to learn more about them. If you hit play with the default settings, the program will generate a video for you. The video below represents the displacement (X50 magnification) response over the entire 10 step time history.

Looping the Animation over a Range of Time Steps
By default, Ansys animates the video for the entire history. However, even though it is not obvious, you have the ability to limit the animation to a give time step range.
The total displacement time history is shown in Figure 5.

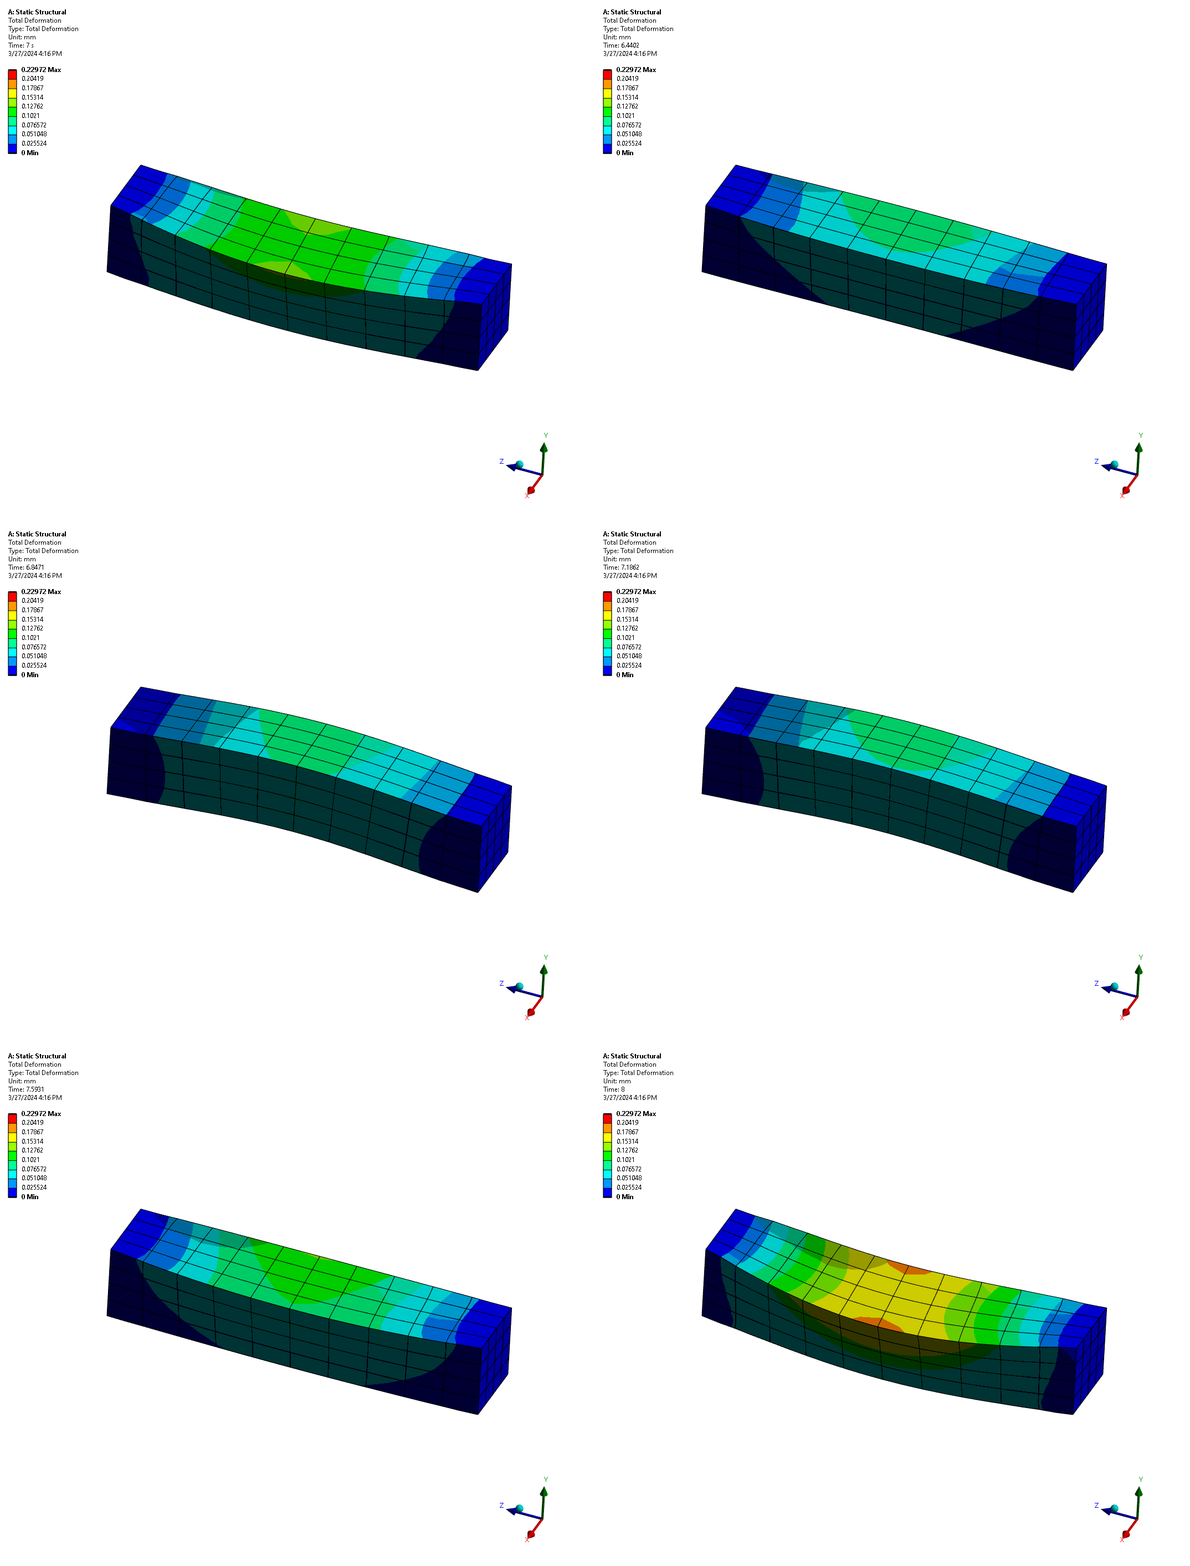
Suppose you want to view the animation for Time step 6 to 8. You can click on the graph at the 6 second mark and drag your cursor to the 8 second mark. The area that you have selected will be highlighted:

Now, any animations settings that you apply such as the number of frames to process or the animation time, will be applied to the selected range and the video will be generated accordingly. The video below shows a 3 second video with 30 frames:

I hope this short article was useful for some of the readers.
